2016 Olympics, Country Medal Count by Sport
Data
Data is collected from the Rio 2016 Summer Olympics website.
library(rvest)
library(plyr)
library(ggplot2)
library(RColorBrewer)

page <- read_html("https://www.rio2016.com/en/medal-count-sports")
# Extract events and country medals
p.info <- page %>% html_nodes("#wr .title , #wl .title , #wp .title , #vo .title , #tr .title , #gt .title , #te .title , #tk .title , #tt .title, #sy .title , #sw .title , #sh .title , #sa .title , #ru .title , #ro .title , #gr .title , #mp .title , #ow .title , #ju .title , #ho .title , #hb .title , #go .title , #fb .title , #fe .title , #eq .title , #dv .title , #ct .title , #cr .title , #cm .title , #cb .title , #cf .title , #cs .title , #bx .title , #bv .title , #bk .title , #bd .title , #at .title , #ar .title , #ga .title , .country") %>% html_text

re <- rle(nchar(p.info) > 3)

df.med <- data.frame(events=rep(p.info[nchar(p.info) > 3],re$lengths[re$lengths > 1]), cou=p.info[nchar(p.info) == 3])

df.f <- ddply(df.med, .(events), summarise, country=names(prop.table(table(factor(cou)))), n.per=as.numeric(prop.table(table(factor(cou)))))
df.f2 <- ddply(df.f, .(events), mutate, csum=cumsum(n.per)-n.per/2)

# Plot
colourCount <- length(unique(df.f$country))

ggplot(df.f2, aes(x=events, y=n.per,fill=country)) +  geom_bar(stat="identity") + scale_fill_manual(values = colorRampPalette(brewer.pal(9, "Set1"))(colourCount)) +theme(axis.text.x = element_text(angle = 90, hjust = 1, vjust=-0.001)) + geom_text(aes(x = events, y = csum, ymax = 1, label = country, hjust = 0.5), size=2.5) + xlab("Sporting Event") + ylab("") + ggtitle("2016 Summer Olympics\nPercentage of Medals by Country in Each Sport")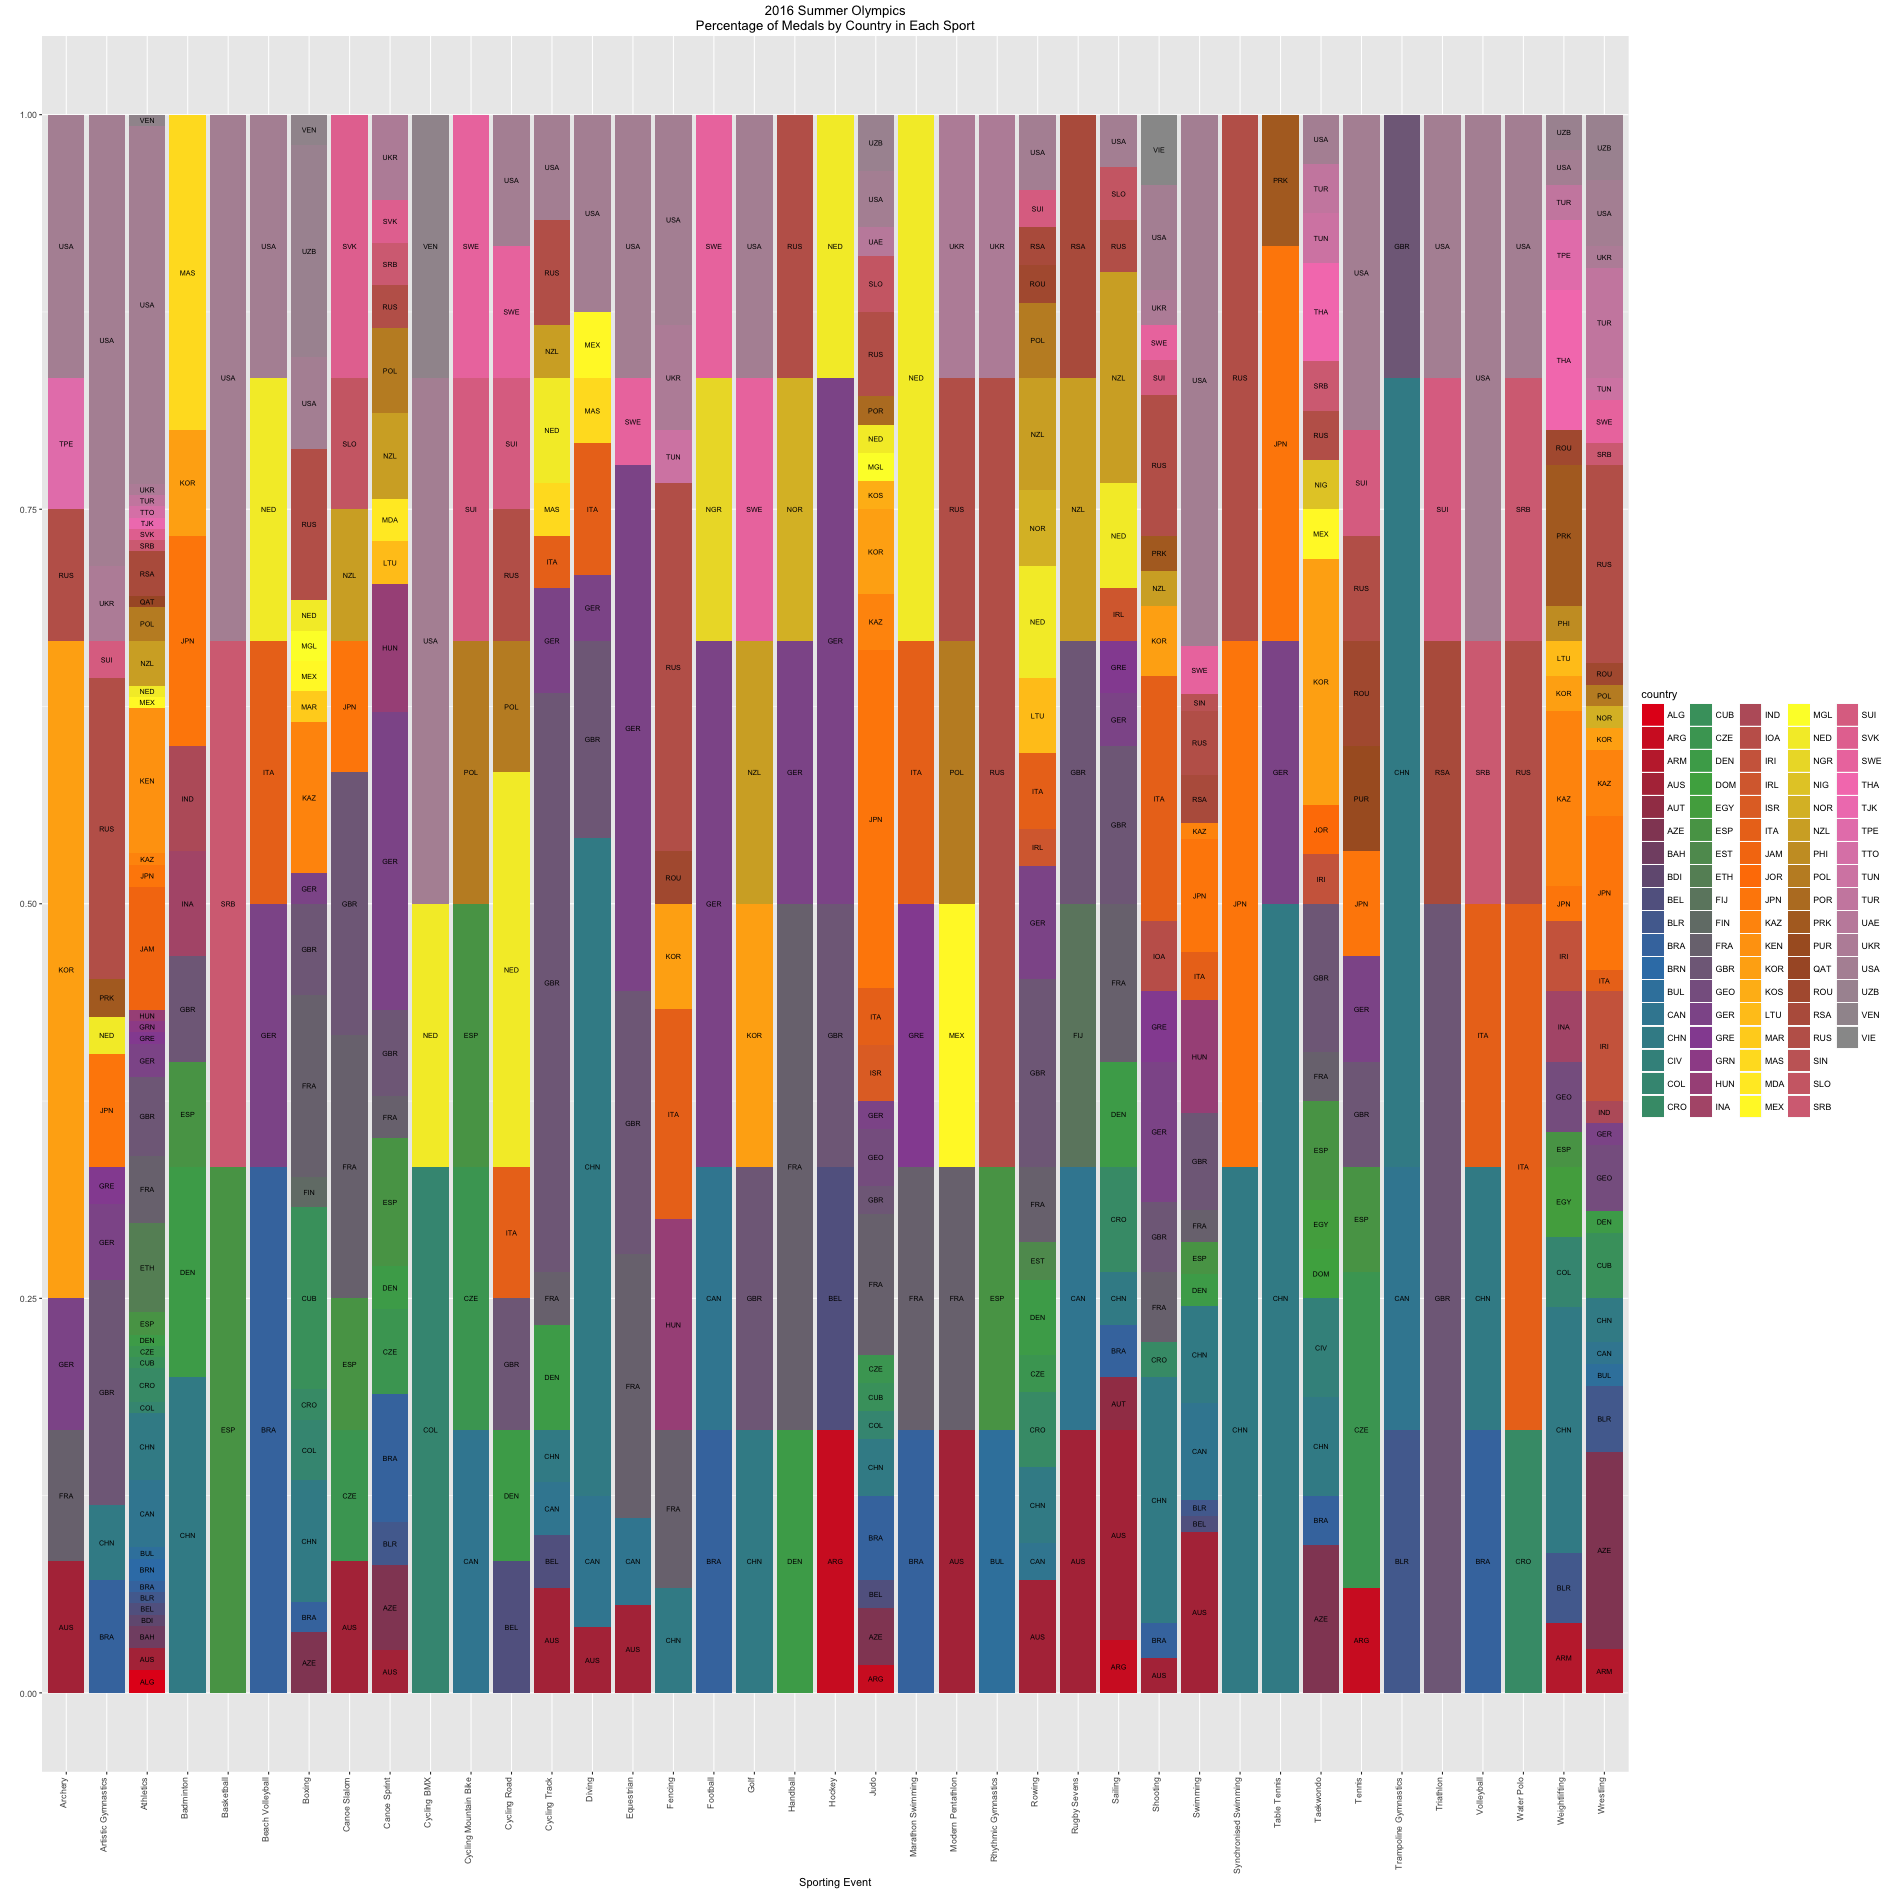
What this has taught me is I really need to get back into d3.js to have more interactive plots.