Winnipeg Transit Bus Pass Ups - Initial Look and University of Manitoba Routes
Introduction
Bus pass ups occur when a bus is to full to accept additional riders at a stop. This can cause frustration with the transit system, causing riders waiting longer, late/missing appointments, and causes loss in confidence of the system.
Data
The data was acquired from the fantastic Open Data Portal for the City of Winnipeg. Winnipeg Transit publishes daily data set to the portal allowing for export or querying through Socrata Open Data API (SODA). For this, an export in comma separated value (csv) will be used, though R packages due exist to communicate the SODA such as RSocrata. Data was recorded by the operator pressing a button to record the event of a pass up.
The data set from the export will have the following types in R (data set page has column info to compare with):
| Column.Name | Type | Description |
|---|---|---|
| Pass Up Id | number | Unique Key (pk) |
| Pass Up Type | character | Type of pass up |
| Time | character | Time at which the button was pressed to record a pass up |
| Route Number | number | Which route number this occurred on |
| Route Name | character | Name of route |
| Route Destination | character | Destination for the bus |
| Location | character | Location where the button was pressed to record a pass up |
Data Clean Up
After reading in the export, taking a look at what kind of data is available and if clean up is needed.
summary(passUps)## Pass.Up.ID Pass.Up.Type Time Route.Number Route.Name Route.Destination
## Min. : 363450 Length:126736 Length:126736 Min. : 1.0 Length:126736 Length:126736
## 1st Qu.:1280690 Class :character Class :character 1st Qu.: 18.0 Class :character Class :character
## Median :1953240 Mode :character Mode :character Median : 38.0 Mode :character Mode :character
## Mean :1903768 Mean : 60.7
## 3rd Qu.:2585844 3rd Qu.: 75.0
## Max. :3083223 Max. :185.0
## NA's :49
## Location
## Length:126736
## Class :character
## Mode :character
##
##
##
## We want to remove ‘bad’ data, in this case, where the route number is missing.
passUps <- passUps[!is.na(passUps$Route.Number),]Since pass up type is a character class, this must be looked at to get a sense of the data.
unique(passUps$Pass.Up.Type)## [1] "Wheelchair User Pass-Up" "Full Bus Pass-Up"From this, the ‘Full Bus Pass-Up’ events are what the focus is on.
passUps.fb <- passUps[passUps$Pass.Up.Type == "Full Bus Pass-Up",]Next, the Time column is character. This should be converted to date/time class.
## [1] "10/30/2019 03:52:39 PM"In the future, we will want to analyse the Location data, I will leave the clean up for this another time.
Initial Look
For analysis, we will be using dply and ggplot2.
library(dplyr)
library(ggplot2)
library(scales)
Looking first at the top routes with pass ups:
knitr::kable(passUps.fb %>% group_by(route=Route.Number) %>% summarise(count=n()) %>% arrange(desc(count)) %>% head(10), align='c')| route | count |
|---|---|
| 11 | 10397 |
| 75 | 9113 |
| 162 | 9050 |
| 160 | 6785 |
| 18 | 6005 |
| 19 | 5981 |
| 21 | 5473 |
| 36 | 4193 |
| 16 | 4139 |
| 22 | 3324 |
With route 11, 75, 162, 160, and 19 being the routes with the largest number of pass ups. Since a bus route can have multiple sub routes (to/from different destinations), we will want to see if there is particular routes that have more pass up events.
routePassUps.dest <- passUps.fb %>% group_by(route=Route.Number, from=Route.Name, to=Route.Destination) %>% summarise(count=n()) %>% arrange(desc(count))| route | from | to | count |
|---|---|---|---|
| 75 | Crosstown East | To University of Manitoba | 5356 |
| 160 | Downtown-UM | To University of Manitoba | 3927 |
| 162 | Ft. Richmond-St. Norbert Express | To University of Manitoba | 3675 |
| 36 | Northwest Super Express | To U of Manitoba | 3095 |
| 75 | Crosstown East | To Kildonan Place | 2997 |
This shows that trips to the University of Manitoba occupies the top spots and will be focused on here.
The routes can be found below. The 160 and 162 share a lot of the same stops but 162 services St. Norbert area which greatly extends the range into south Winnipeg.
| Route | Number of Stops |
|---|---|
| 36 Northwest Super Express | 1 |
| 75 Crosstown East | 1 |
| 160 Downtown to University of Manitoba | 1 |
| 162 Downtown to Ft Richmond to U of M to St Norbert Express | 1 |
The above lists total number of stops on a round trip route.
University of Manitoba Top Pass Up Routes
Let us filter out the results from above.
topUofMPassUp <- passUps.fb %>% filter(Route.Number %in% c(75, 160, 162, 36)
                                       & Route.Name %in% c('Crosstown East', 'Downtown-UM', 'Ft. Richmond-St. Norbert Express', "Northwest Super Express")
                                       & Route.Destination %in% c('To University of Manitoba', 'To University of Manitoba', 'To University of Manitoba', 'To U of Manitoba'))
Since this is trips mostly to the University of Manitoba, we should expect most of these pass ups to occur during Fall and Winter sessions with minimal pass ups during the summer months.
uOfMMonth <- topUofMPassUp %>% mutate(month=format(as.Date(Time, format="%m/%d/%Y"), "%m")) %>%
  group_by(month=month, route=Route.Number, route.name=Route.Name, route.destination=Route.Destination) %>%
  summarise(count=n())

ggplot(uOfMMonth, aes(month, count, fill=factor(route))) +
  geom_bar(stat="identity", position='dodge') +
  guides(fill=guide_legend(title=NULL)) +
  xlab('Month') +
  ylab('Number of Pass Ups') +
  ggtitle('Month vs Number of Pass Ups of Routes 36, 75, 160, 162') +
  scale_x_discrete(labels=month.abb)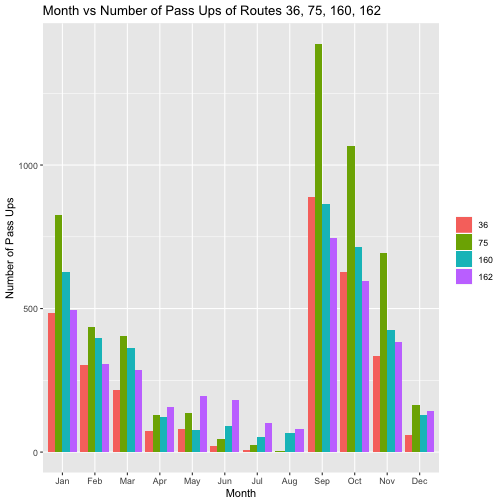
The increase in pass ups in September and January most likely coincide with the start of Fall/Winter terms at the University of Manitoba as well as other schools being back in session. The decline in pass ups between September - December and January - April could be due to many reasons such as riders car pooling, not attending every class, leaving earlier/later to avoid full busses, or dropping out. Since daily ridership numbers and University of Manitoba enrollment numbers per month are not available, it is not possible to decern why this change occurs.
Looking at this but breaking it over the years:
uOfMMonYr <- topUofMPassUp %>% mutate(yearMon=format(Time, "%Y-%m-01")) %>%
  group_by(yearMon, route=Route.Number, route.name=Route.Name, route.destination=Route.Destination) %>%
  summarise(count=n())

ggplot(uOfMMonYr, aes(as.Date(yearMon), count, fill=factor(route))) +
  geom_bar(stat="identity", position="dodge") +
  scale_x_date(breaks=pretty_breaks(nrow(uOfMMonYr)/12)) +
  theme(axis.text.x = element_text(angle=90, vjust=0.5)) +
  guides(fill=guide_legend(title=NULL)) +
  ylab('Number of Pass Ups') +
  xlab('Month of Year') +
  ggtitle('Month of Year vs Number of Pass Ups for Routes 36, 75, 160, 162')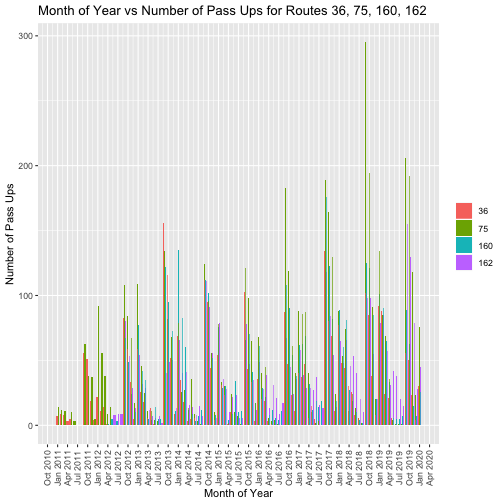
This does look like it is happening every year in January and September.
Another observation we should expect is that weekend pass ups should be minimal. Further, the 36 also does not run on weekends, so we should not expect any pass ups for the 36 on Saturday or Sunday.
# %a Full weekday
uOfMWeek <- topUofMPassUp %>% mutate(day=format(Time, "%A")) %>%
  group_by(day, route=Route.Number, route.name=Route.Name, route.destination=Route.Destination) %>%
  summarise(count=n())

ggplot(uOfMWeek, aes(day, count, fill=factor(route))) +
  geom_bar(stat="identity", position="dodge") +
  theme(axis.text.x = element_text(angle=90, vjust=0.5)) +
  guides(fill=guide_legend(title=NULL)) +
  scale_x_discrete(limits=c('Sunday','Monday', 'Tuesday', 'Wednesday','Thursday', 'Friday','Saturday')) +
  xlab('Day of Week') +
  ylab('Number of Pass Ups') +
  ggtitle('Day of Week vs Number of Pass Ups of Routes 36, 75, 160, 162')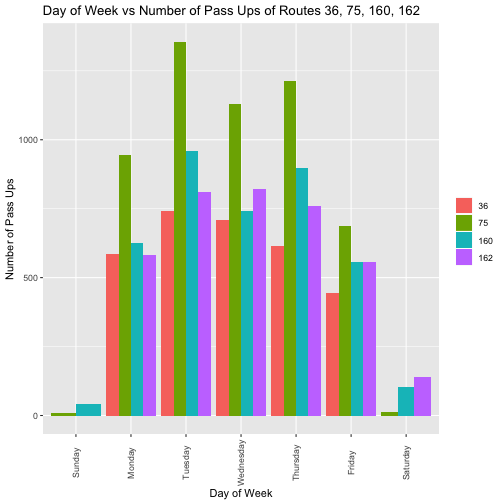
Which we see now that there is very few pass ups going to the University of Manitoba on the weekends.
A quick look at the times of pass ups can see if these are ‘rush hour’ type pass ups or happening consistently through the day. For this, the pass up times will be rounded to the nearest hour. This could be drilled down further but will provide an initial exploratory look.
The exploratory look will not take into account that different routes have Monday, Wednesday, and Friday schedules but different schedules on Tuesday/Thursday. Again, weekend schedules may be different as well, this could be explored later.
uOfMHourly <- topUofMPassUp %>% mutate(hour=format(round(Time, units="hours"), "%H:%M")) %>%
  group_by(hour, route=Route.Number, route.name=Route.Name, route.destination=Route.Destination) %>%
  summarise(count=n())

ggplot(uOfMHourly, aes(hour, count, fill=factor(route))) +
  geom_bar(stat="identity", position="dodge") +
  theme(axis.text.x = element_text(angle=90, vjust=0.5)) +
  guides(fill=guide_legend(title=NULL)) +
  scale_x_discrete(limits=c(paste0(paste0("0",1:9), ":00"), paste0(11:24,":00"))) +
  xlab('Hour') +
  ylab('Number of Pass Ups') +
  ggtitle('Hour of Day vs Number of Pass Ups of Routes 36, 75, 160, 162')
## Warning: Removed 5 rows containing missing values (geom_bar).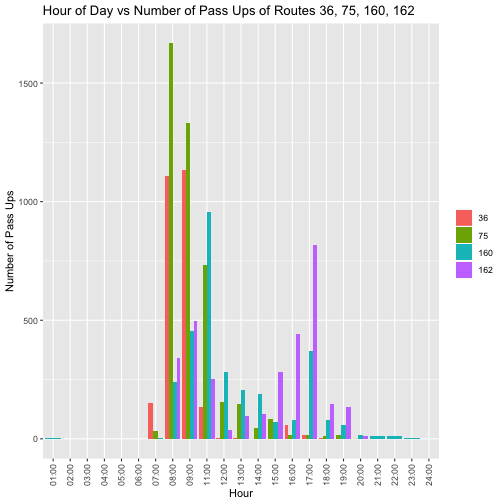
From this, the 36 and 75 have spikes in the morning while almost no pass ups going to the University of Manitoba during the afternoon evening. The 160/162 has spikes both in the morning and in the afternoon which may be due to the areas serviced. As both run from downtown to the south parts of Winnipeg and even past the perimeter on the to University of Manitoba route, it may be different demographics in the afternoon, people returning from work than students going to class.
Further Analysis
Taking this further, looking at which areas along these routes a pass up is likely to occur, using the GPS coordinates given may be of interest. This, as well as exploratory analysis here can be drilled further down due to scheduling into day/time and years.