Overwatch Season 1 - Hero Playtime vs Rank
Introduction
While playing in ranked, during early days of the season Symmetra and Mei seemed to be in every single game. As the season went on and I was climbing to higher ranks I noticed much less Symmetra play and the Mei players seemed to be using it more in specific instances, such as overtime or delaying the game to give the team better chance in overtime.
Genji was the other hero always seemingly there. This may be confirmation bias, but as the season went on the Genji players that did play him could carry games and probably rose to a higher rank more swiftly.
To do this, data was collected by scraping Blizzard’s Overwatch site using the method described in a previous post. Data was scraped and stored in a MySQL database from 2016-08-19 to 2016-09-05 which was the off season between the end of season 1 and the start of season 2.
Data
During the data collection there was 27663 players recorded with a breakdown of regions as follows:
knitr::kable(dbGetQuery(con, "SELECT region AS Region, COUNT(region_fk) AS Total FROM owdb.battletags LEFT JOIN owdb.region ON region.idRegion = region_fk GROUP BY battletags.region_fk;"), align="c")| Region | Total |
|---|---|
| us | 19371 |
| eu | 7916 |
| kr | 376 |
Out of the players, 27663 played at least 10 competitive games where only 24 did not.
Since the data should be normal, we will just visually look at it. More formal tests like Shapiro-Wilk or Jarque-Bera test (skewness and kurtosis).
pRanks <- dbGetQuery(con, "SELECT rank, COUNT(*) AS NumPlayers FROM rank WHERE rank > 0 GROUP BY rank")

qplot(rank, data=pRanks, geom="histogram", binwidth=1, weight=NumPlayers, xlab="Player Rank", ylab="Number of Players", main="Number of Players vs Rank")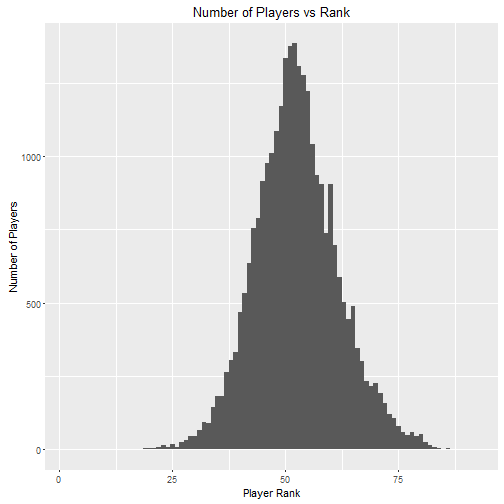
It does look close enough to be normal distribution.
Hero Distribution
The number of heros played may be skewed but expected that higher ranked players may be playing less diverse amount of heros.
dHero <- dbGetQuery(con, "SELECT rank, avg(num_heroes) as avg_num_heroes
FROM (
SELECT COUNT(distinct s.Heroes_idHeroes) as num_heroes, r.rank
FROM owdb.game_career_stat s
LEFT JOIN owdb.rank r ON r.battleTags_idbattleTags = s.battleTags_idbattleTags
WHERE s.time_played > 0 AND r.rank > 0
GROUP BY s.battleTags_idbattleTags) as d
GROUP BY rank;")

qplot(rank, data=dHero, geom="histogram", binwidth=1, weight=avg_num_heroes, xlab="Player Rank", ylab="Average Number of Champions Played", main="Average Number of Champions Played vs Player Rank")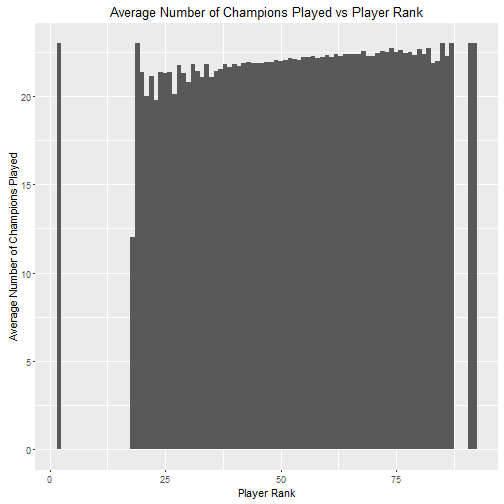
For the most part, the average number of champions played is consistent with a few more on average as the rank goes up.
Hero Play Times
Need to set up an SQL query to grab the data as an average of the percentage of time played per hero per rank:
createQ <- function(hero) {
  q <- paste0("SELECT (time_char / time_all)*100 AS per, s.rank AS rank
FROM
(SELECT avg(j.time_played) as time_all, r.rank
FROM owdb.game_career_stat j
LEFT JOIN owdb.rank r ON r.battleTags_idbattleTags = j.battleTags_idbattleTags
WHERE (Heroes_idHeroes = (SELECT idHeroes FROM owdb.heroes WHERE name = 'all heroes'))
AND IsComp_idIsComp = 2 AND rank > 0
GROUP BY r.rank, j.Heroes_idHeroes) as p,
(SELECT avg(f.time_played) as time_char, r.rank
FROM owdb.game_career_stat f
LEFT JOIN owdb.rank r ON r.battleTags_idbattleTags = f.battleTags_idbattleTags
WHERE (Heroes_idHeroes = (SELECT idHeroes FROM owdb.heroes WHERE name = '", hero,"'))
AND IsComp_idIsComp = 2 AND rank > 0
GROUP BY r.rank, f.Heroes_idHeroes) as s
WHERE p.rank = s.rank;")
  return(q)
}
Symmetra
Symmetra seemed popular at the beginning of the game when you could build a teleporter to quickly transport your team from spawn to the battlefield. However as the season went on, her lack of combat stats and tower placements was quickly figured out and became less useful. The teleporter location was also easy for flanking characters hunt down and destroy, nullifying one of her biggest assets and reason to play her.
sym <- dbGetQuery(con, createQ("symmetra"))

qplot(rank, data=sym, weight=per, binwidth=1, xlab="Rank", ylab="Percentage of Time Played", main="Symmetra\nPercentage of Play Time vs Rank")
Symmetra besides an anomoly at rank 28, seems to be played pretty consistently at ranks less than 50 but starts falling off as you get to higher ranks. This tends to make sense as the teleporter may not be as useful in later ranks when players are much more coordinated on attack and defense, nullifying the need for teleporters.
Mei
Mei seemed to be in every game but on some maps and situations, she can be very useful to help win the game for your team.
mei <- dbGetQuery(con, createQ("mei"))

qplot(rank, data=mei, weight=per, binwidth=1, xlab="Rank", ylab="Percentage of Time Played", main="Mei\nPercentage of Play Time vs Rank")
Again, Mei follows a similar trend as Symmetra, seeing more average percentage of play time at the lower less than 50 ranks and starts to fall off as you get to the higher ranks. This may be her utility is less useful in a coordinated team of players or she was not picked to play for all the map, rather picked in situations that she can stall out a team.
Genji
Genji has possibly one of the highest skill caps in the game. His kit combines very high mobility with the ability to shut down DPS and most support characters easily makes a good Genji player look amazing in the game.
gen <- dbGetQuery(con, createQ("genji"))

qplot(rank, data=gen, weight=per, binwidth=1, xlab="Rank", ylab="Percentage of Time Played", main="Genji\nPercentage of Play Time vs Rank")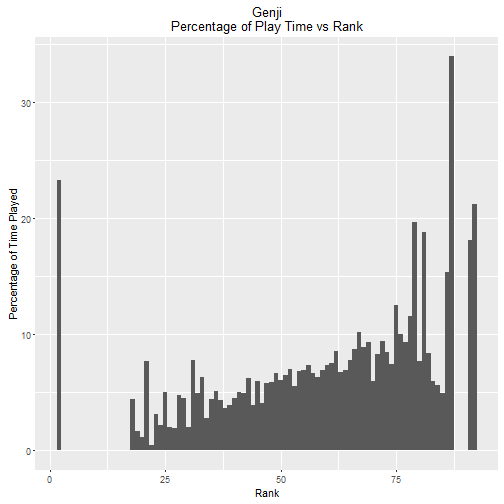
The graph supports that higher ranked players, tend to be more focused on Genji.
Notes On Data
Issues with the data come from the sample size. With millions of players, the sample size is very small and my be skewed to certain player groups.
Graphs are deceptive as well in a way and related to sample size. With so few players at the lower and upper ends of the spectrum, a single player may skew the percentage of time played.